


September 4, 2026
While 68% of shoppers nationally feel increasing pressure to find deals, new data show Ocala, Florida consumers are the most engaged in online deal-seeking.
Deal hunting used to feel optional. In 2026, it became part of the purchase process. With consumer prices still rising and food prices up three percent over the year ending in July, Americans are routinely checking sales, coupon codes, loyalty prices, and competing retailers before they buy.
To understand where this behavior is most concentrated and why shoppers increasingly rely on it, Savings.com combined two sources of evidence: more than three million coupon engagements across 761 U.S. cities and a survey of 1,032 adults about how they shop and save. Together, the results show that bargain hunting is both a nationwide routine and, for many households, a financial defense.
Key findings
- Ocala, Florida, leads the country for online deal engagement, with 12.88 Savings.com coupon clickouts per 100 residents. Atlanta ranks fourth overall and first among cities with at least 500,000 residents.
- Deal seeking is nearly universal: 95% of adults recently looked for a deal, and 59% said they look for deals to stay within their household spending budgets.
- Financial pressure is rising: 68% of respondents feel more pressure to find deals than they did two years ago. Women are more likely than men to describe that pressure as significant (40% vs. 29%).
- Deals are necessary for affording the basics: 64% of respondents said it is very or extremely necessary to get deals when shopping for groceries, and 50% said deals were very or extremely necessary for purchasing gas.
- Americans estimate that deals save them about $109 per month. Adults under 30 report the largest monthly savings, averaging approximately $142.
Ocala, Florida is America's Deal-Hunting Capital
America's strongest online deal engagement is not limited to its biggest shopping hubs. Ocala, Florida, recorded the most Savings.com coupon activity relative to population, followed by Bloomington and Columbus, Indiana.
Atlanta ranks fourth overall and first among cities with at least 500,000 residents. Its 10.5 deal engagements per 100 residents were more than three times the rate in New York City.
How we ranked the cities
Unlike studies that rely on consumers' self-reported shopping habits, this analysis measures an action: clicking a coupon or deal and continuing to a retailer's website. Savings.com analyzed one year of outbound deal engagements recorded in Google Analytics 4, which included over three million engagements from 1.6 million visitors. A qualifying engagement occurred when a visitor clicked a coupon or deal that directed them from Savings.com to a retailer from Savings.com. The analysis included 761 U.S. cities with populations of at least 50,000 and at least 100 qualifying outbound deal engagements during the study period.
Top 25 U.S. cities for online deal engagement
| Rank | City | Deal engagements per 100 residents |
|---|---|---|
| 1 | Ocala, Florida | 12.88 |
| 2 | Bloomington, Indiana | 11.73 |
| 3 | Columbus, Indiana | 10.93 |
| 4 | Atlanta, Georgia | 10.50 |
| 5 | Bradenton, Florida | 10.14 |
| 6 | Wheaton, Illinois | 9.68 |
| 7 | Miami, Florida | 8.64 |
| 8 | Galveston, Texas | 8.35 |
| 9 | Winter Haven, Florida | 8.04 |
| 10 | Orlando, Florida | 7.82 |
| 11 | Boston, Massachusetts | 7.82 |
| 12 | Marietta, Georgia | 7.70 |
| 13 | Salt Lake City, Utah | 6.87 |
| 14 | Santa Clara, California | 6.75 |
| 15 | Lafayette, Indiana | 6.57 |
| 16 | Seattle, Washington | 6.53 |
| 17 | Danbury, Connecticut | 6.41 |
| 18 | Daytona Beach, Florida | 6.36 |
| 19 | Hampton, Virginia | 6.18 |
| 20 | Sarasota, Florida | 6.12 |
| 21 | Birmingham, Alabama | 6.06 |
| 22 | Turlock, California | 5.96 |
| 23 | Minneapolis, Minnesota | 5.67 |
| 24 | Erie, Pennsylvania | 5.56 |
| 25 | Manhattan, Kansas | 5.53 |
Source: Savings.com analysis of one year of qualifying outbound coupon engagements. Cities required at least 50,000 residents and 100 qualifying engagements.
Florida and the South over-index for deal engagement
Florida is a geographic hotspot for deal-seeking cities. Sixteen Florida cities appear in the top 100, more than any other state, including five in the top 20: Ocala, Bradenton, Miami, Winter Haven, and Orlando.
Florida accounts for approximately eight percent of all qualifying cities but 16 percent of the top 100, meaning it appears among the leaders at about twice the rate expected from its representation in the dataset.
Southern cities make up approximately 40 percent of the top 100, compared with 32 percent of all qualifying cities. Atlanta, Galveston, Hampton, Birmingham, Greenville, and other Southern cities all rank highly. Three Georgia cities make the top 100, and Georgia has the fifth-highest average engagement rate among states with at least five qualifying cities.
Several factors could contribute to the regional pattern, including household demographics, retail access, local shopping habits, and Savings.com's reach within each market. The behavioral data alone cannot determine which factors caused it.
Smaller cities fill the ranking, but size does not fully explain engagement
Cities with populations between 50,000 and 200,000 account for 73 of the top 100 deal-seeking cities. That produces a list filled with places such as Ocala, Bloomington, Columbus, Bradenton, and Wheaton rather than only nationally prominent shopping markets.
However, smaller cities account for nearly 85 percent of all cities in the analysis. Their numerical dominance should not be interpreted as evidence that small-city residents are inherently more deal-conscious. Average engagement was actually higher among cities with at least 500,000 residents than among either of the smaller population groups.
Average deal engagement by city population
| City population | Qualifying cities | Average engagements per 100 residents |
|---|---|---|
| 50,000-199,999 | 644 | 1.86 |
| 200,000-499,999 | 82 | 2.15 |
| 500,000 or more | 35 | 3.22 |
Source: Savings.com city-level deal-engagement analysis, 2026.
The takeaway is more nuanced: small cities hold many of the top individual positions, but larger cities have a higher average deal engagement rate as a group.
Atlanta is the standout major city for deal-seeking
Atlanta records more deal engagement per capita than any other city with at least 500,000 residents. Its rate of 10.5 engagements per 100 residents ranks fourth across all 761 cities analyzed. Atlanta's deal-engagement rate was 22 percent higher than Miami's, more than twice Los Angeles' rate, and more than three times New York City's rate.
Top large cities for deal-seeking (among cities with at least 500,000 residents)
| Rank | City | Deal engagements per 100 residents |
|---|---|---|
| 1 | Atlanta, Georgia | 10.50 |
| 2 | Boston, Massachusetts | 7.82 |
| 3 | Seattle, Washington | 6.53 |
| 4 | Denver, Colorado | 5.32 |
| 5 | Las Vegas, Nevada | 5.30 |
| 6 | Los Angeles, California | 4.86 |
| 7 | Dallas, Texas | 4.28 |
| 8 | Baltimore, Maryland | 4.23 |
| 9 | Chicago, Illinois | 4.08 |
| 10 | Washington, D.C. | 3.79 |
Source: Savings.com city-level deal-engagement analysis, 2026.
The high cost of living often associated with large metros does not fully explain the rankings. The leaders include expensive coastal markets such as Boston and Seattle, as well as comparatively more affordable cities in the South and Midwest. Deal engagement likely reflects a combination of household characteristics, digital shopping habits, retail options, and Savings.com's local audience reach.
Cities with the least deal engagement
| City | Deal engagements per 100 residents |
|---|---|
| Midwest City, Oklahoma | 0.34 |
| Paramount, California | 0.38 |
| Lynwood, California | 0.40 |
| Taylorsville, Utah | 0.40 |
| National City, California | 0.42 |
| Highland, California | 0.43 |
| South Gate, California | 0.44 |
| Pico Rivera, California | 0.44 |
| Compton, California | 0.44 |
| Pharr, Texas | 0.49 |
Source: Savings.com city-level deal-engagement analysis, 2026.
California dominates the low end of the ranking. Seven of the 10 cities with the lowest engagement are in the state, including five in Los Angeles County. The pattern extends beyond the bottom 10: California accounts for 44 of the bottom 100 cities, despite representing only 23 percent of all qualifying cities. California cities averaged 1.46 Savings.com deal engagements per 100 residents, compared with 2.10 elsewhere. That does not necessarily mean Californians are less interested in discounts; it may indicate they find deals through retailer apps, loyalty programs, competing platforms, or other channels not captured by this analysis.
Deal Hunting Is Nearly Universal and Increasingly Necessary
The city rankings show where online deal engagement is most concentrated, but deal seeking itself is a nationwide habit. Ninety-five percent of surveyed Americans had looked for a deal in the past 30 days, while 98 percent had used at least one strategy to lower the price of a purchase.
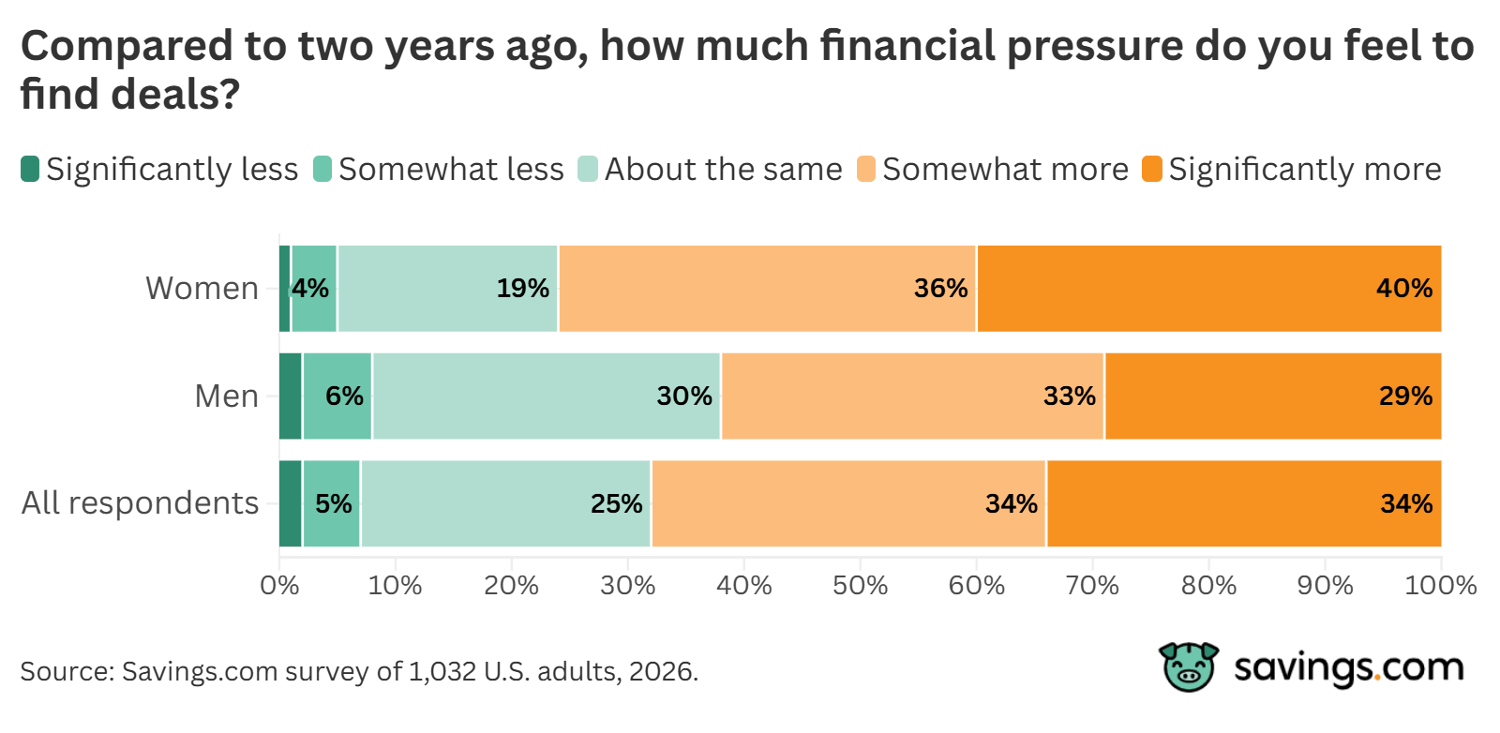
For many shoppers, this is more than a preference. Sixty-eight percent feel more pressure to find deals than they did two years ago, including 34 percent who feel significantly more pressure.
Food prices help explain why household budgets remain strained. Overall, food prices were three percent higher in July 2026 than one year earlier. The USDA expects food-at-home prices to increase an average of 2.7 percent in 2026, compounding the increases households have absorbed since 2020.
Women feel more pressure to stretch household budgets
The increased pressure is not evenly distributed. Seventy-six percent of women feel somewhat or significantly more pressure to find deals than they did two years ago, compared with 62 percent of men. Women were especially likely to report a significant increase in pressure: 40 percent said so, versus 29 percent of men.
Their motivations point to the demands of managing a tighter household budget. Sixty-four percent of women said deals help them remain within budget, compared with 53 percent of men. Women were also more likely to say they avoid paying full price when a deal is available and use the savings to preserve money for other expenses or goals.
What drives people to look for deals
Which of the following reasons, if any, motivate you to look for deals?
| Motivation | All respondents |
|---|---|
| I want to save money for other expenses or goals | 69% |
| I prefer not to pay full price when a deal may be available | 66% |
| I need to reduce the cost to stay within my budget | 59% |
| Getting a deal makes a purchase feel more worthwhile | 46% |
| I enjoy the process of finding a good deal | 42% |
| I look for deals out of habit | 40% |
| Deals allow me to buy items or services I otherwise would not purchase | 34% |
| Deals allow me to buy a higher-quality option than I otherwise would | 32% |
| I use deals to buy more than I otherwise would | 22% |
Source: Savings.com survey of 1,032 U.S. adults, 2026. Respondents could select all that apply.
Women also more frequently attributed their increased deal-seeking to changes in household expenses and family needs. Together, the findings suggest that women are more likely to experience deal hunting as a practical budget requirement, rather than simply the satisfaction of finding a bargain.
Deals Matter Most on Everyday Essentials
When money is tight, a discount stops being a bonus and can determine what fits within the household budget. That is especially true for groceries: among people who buy groceries, 64 percent consider getting a grocery deal very or extremely necessary.
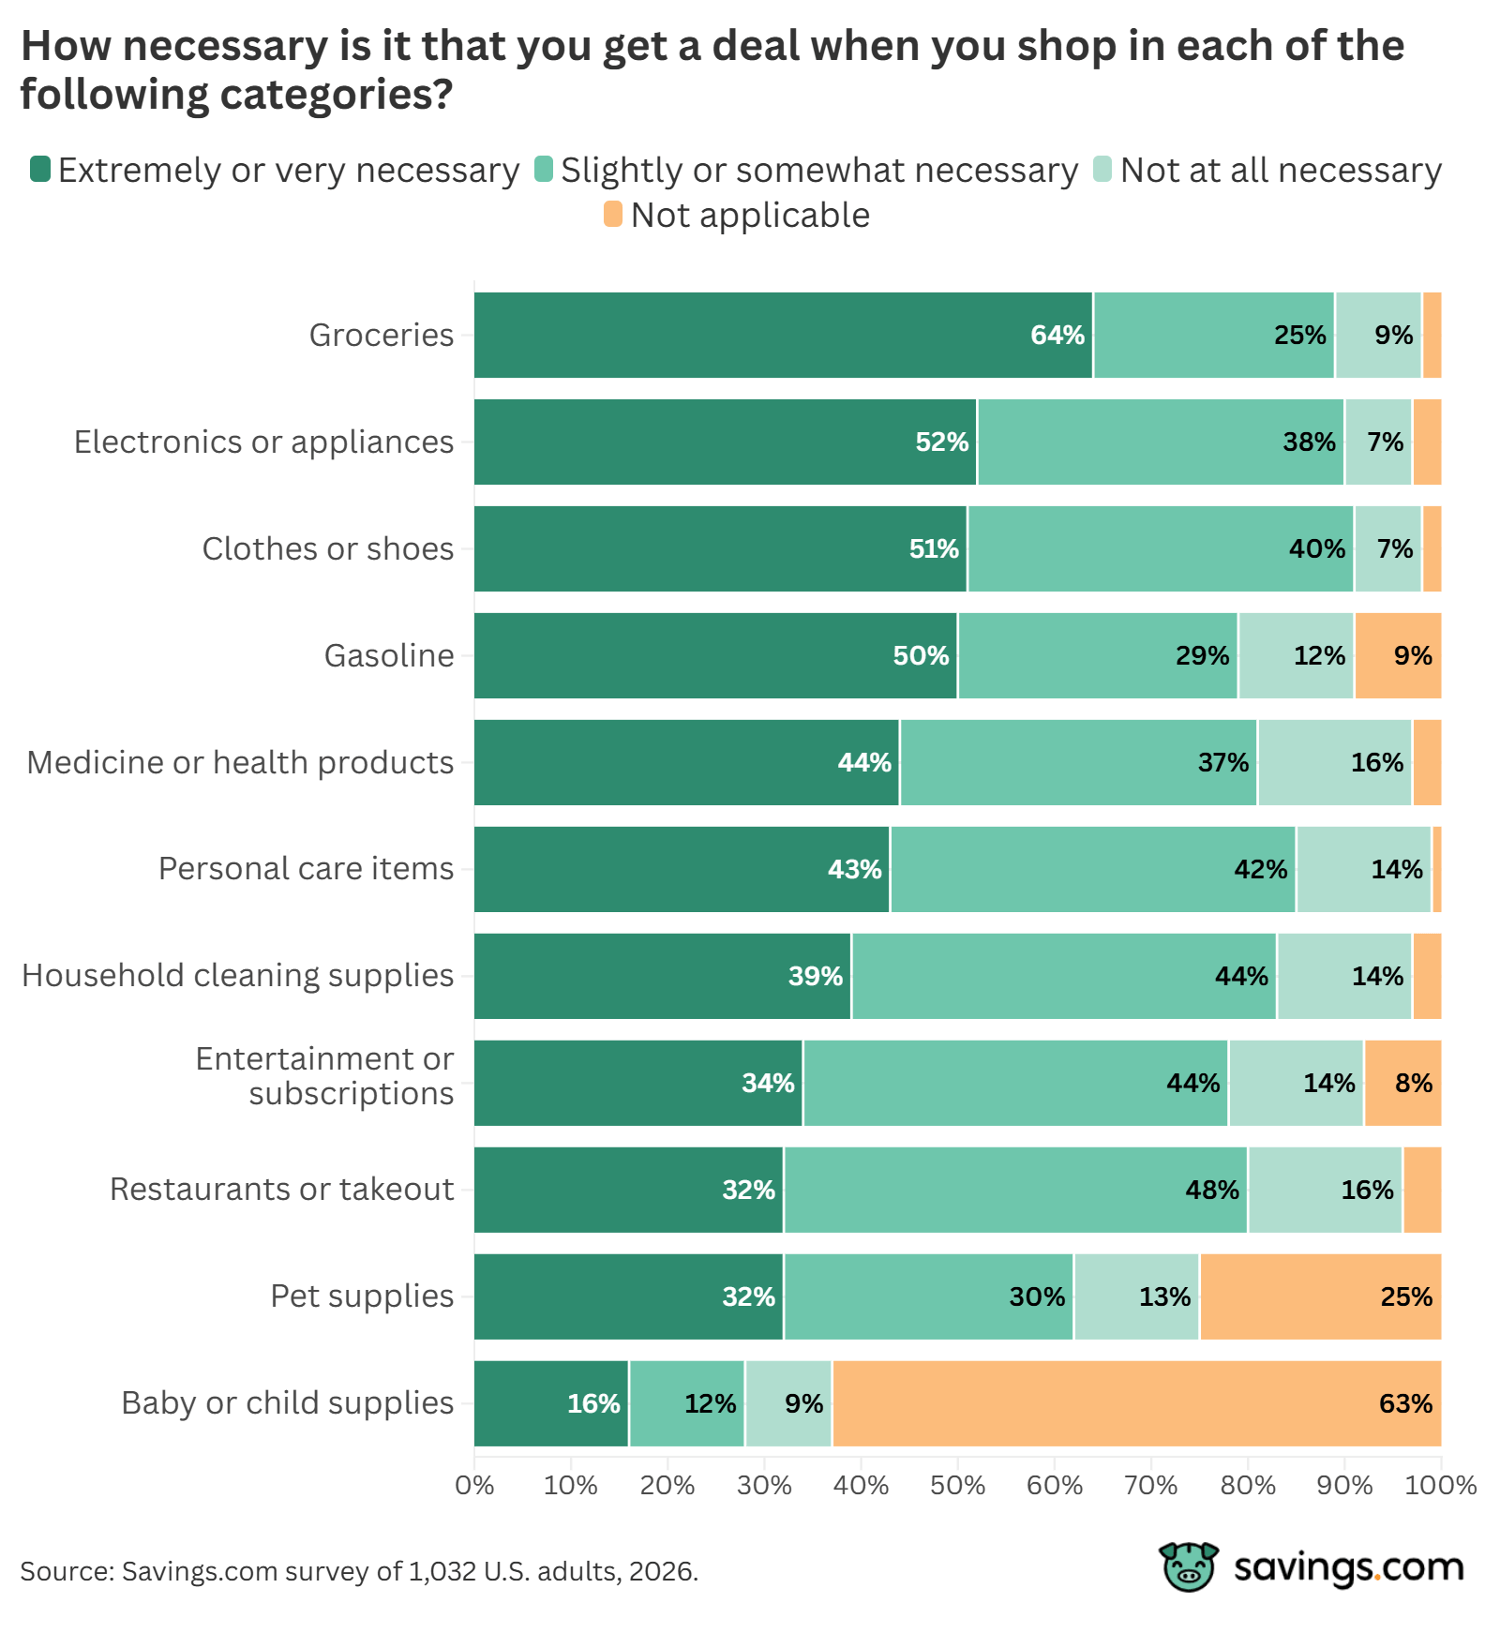
Electronics and appliances rank second, with 52 percent of consumers considering a deal very or extremely necessary, followed by clothing and shoes at 51 percent. As gas prices remain elevated due to the conflict between the U.S. and Iran, 50 percent of people who buy gasoline find deals very or extremely necessary to fill up. These categories combine recurring household needs with purchases for which even a modest discount can yield noticeable savings.
Deals feel less essential for discretionary spending. Thirty-four percent call discounts very or extremely necessary for entertainment or subscriptions, while 32 percent say the same about restaurants or takeout. The pattern is straightforward: consumers place the greatest importance on deals when the purchase is unavoidable, recurring, or expensive.
Shoppers Favor Simple, Immediate Ways to Save
Americans use a mix of digital and traditional strategies, but the most popular methods have one quality in common: they are easy to understand and immediately reduce the price.
Top savings strategies
In the past 30 days, which of the following, if any, have you personally used or done to pay less for something?
| Savings strategy | Percent of respondents |
|---|---|
| A sale or marked-down price | 73% |
| A digital coupon or promo code | 69% |
| Buying from a different store, website, or brand for a lower price | 66% |
| A loyalty program or member price | 55% |
| A cash-back or rebate offer | 31% |
| A bundle or bulk-purchase discount | 24% |
| A paper coupon | 18% |
| A price match | 16% |
| Negotiating or asking for a lower price | 11% |
| None of the above | 2% |
Source: Savings.com survey of 1,032 U.S. adults, 2026. Respondents could select all that apply.
Nearly three-quarters recently bought something on sale, while 69 percent used a digital coupon or promotional code to boost their savings. Two-thirds switched stores, websites, or brands to obtain a lower price, and 55 percent used a loyalty or member price to drive down costs.
More specialized strategies remain less common. Thirty-one percent used cash-back or rebate offers, 24 percent used a bundle or bulk discount, and fewer than one in five used a paper coupon, requested a price match, or negotiated a lower price.
Deal-seeking in 2026 is therefore less about mastering complicated reward systems than about combining several practical tactics: waiting for a sale, checking for a code, comparing sellers, and being willing to try new brands and retailers.
Deal searches move between stores, search engines, and apps
Deal hunting does not occur through one dominant channel. Shoppers move between retailer websites, search engines, physical stores, mobile apps, coupon sites, and promotional messages.
Where people look for deals
In the past 30 days, where, if anywhere, have you looked for deals?
| Deal source | Percent of respondents |
|---|---|
| Retailer websites | 61% |
| Search engines | 57% |
| In-store signs, shelf tags, or printed store ads | 52% |
| Retailer mobile apps | 44% |
| Coupon or deal websites | 42% |
| Retailer or brand emails or text messages | 36% |
| Brand or manufacturer websites | 31% |
| Social media platforms | 30% |
| Cash-back or rebate apps or websites | 25% |
| Friends or family | 18% |
| Browser extensions | 16% |
| None of the above | 1% |
Source: Savings.com survey of 1,032 U.S. adults, 2026. Respondents could select all that apply.
Retailer websites are the most common source, used by 61 percent of respondents, followed by search engines at 57 percent. In-store signs, shelf tags, and printed advertisements remain influential for 52 percent, while 44 percent use retailer apps and 42 percent visit coupon or deal websites like Savings.com.
Age affects where that search happens. Nearly half of adults under 30 recently looked for deals on social media, compared with about one in five adults 45 and older. Older shoppers more frequently rely on in-store signage and retailer emails. The appetite for discounts spans generations, but the route to finding them is increasingly divided between social and app-based discovery for younger adults and retailer-controlled channels for older shoppers.
Younger Shoppers Report Greater Savings With Less Time
Americans estimate that coupons and deals save them approximately $109 per month. For most, finding those savings is a manageable weekly habit: 43 percent spend between 15 minutes and one hour looking for deals, while only nine percent spend more than two hours.
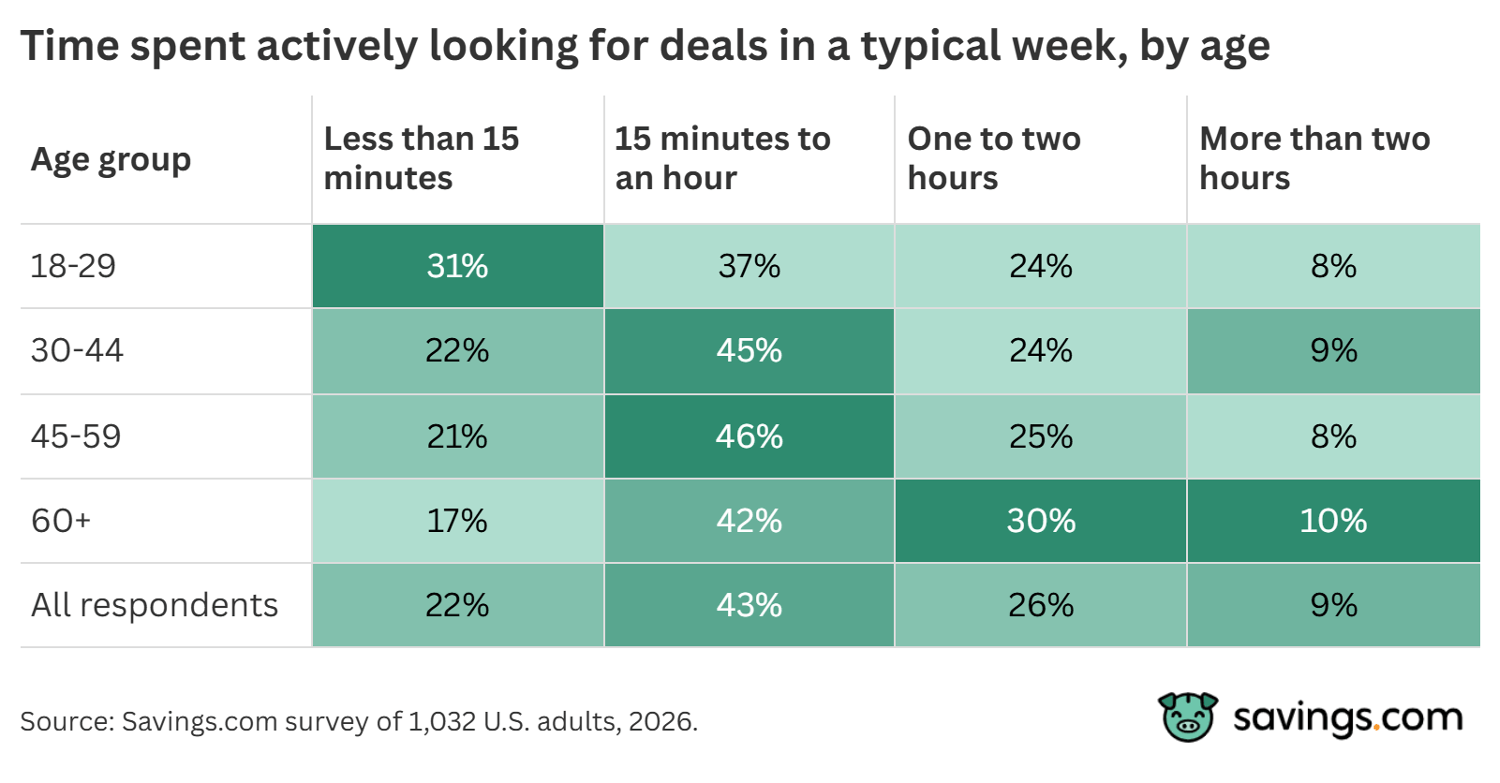
Younger shoppers are the most likely to keep the search brief. Thirty-one percent of adults under 30 spend less than 15 minutes per week looking for deals, compared with 17 percent of adults 60 and older. Conversely, 40 percent of adults 60 and older spend at least an hour, compared with 32 percent of those under 30.
Despite spending less time, younger adults report the largest savings. Adults under 30 estimate that they save approximately $142 per month, nearly twice the $75 reported by adults 60 and older.
Estimated monthly savings from coupons and deals, by age
| Age group | Average estimated monthly savings |
|---|---|
| 18-29 | $142.19 |
| 30-44 | $117.57 |
| 45-59 | $113.64 |
| 60+ | $75.38 |
| All respondents | $108.94 |
Source: Savings.com survey of 1,032 U.S. adults, 2026. Figures are self-reported averages.
Digital channel use may contribute to the difference. Younger adults are more likely to use social media and mobile tools that can surface offers quickly. But the survey cannot establish that channel choice causes their higher reported savings. The gap could also reflect differences in spending, purchase categories, deal usage, or how respondents estimate and remember their savings.
Methodology
Survey
The Savings.com survey was conducted online in 2026 and included 1,032 U.S. adults, balanced to the U.S. population by sex, age, and race. The maximum margin of error is ±3.1 percentage points at the 95% confidence level; subgroup estimates have larger margins. Questions allowing multiple selections sum to more than 100%. Self-reported savings estimates exhibit wide variation and should be read as directional averages, not precise figures.
City deal-engagement analysis
Savings.com analyzed one year (April 28, 2025-April 27, 2026) of qualifying outbound coupon clickouts recorded in Google Analytics 4. In all, the sample included 3,075,989 engagements and 1,669,374 site visitors. The analysis included 761 U.S. cities with populations of at least 50,000 and at least 100 qualifying engagements. Each city's qualifying engagements were divided by its population and multiplied by 100. The resulting rate represents events per 100 residents, not the percentage of residents who used a coupon.
The ranking reflects Savings.com engagement rather than all deal-seeking within a city. Results may be influenced by Savings.com's audience reach, search visibility, traffic acquisition, available offers, device privacy settings, and the accuracy of GA4 geographic attribution.